2018 World TB Day | CDC

TB-Rates-in-the-United-States.jpg


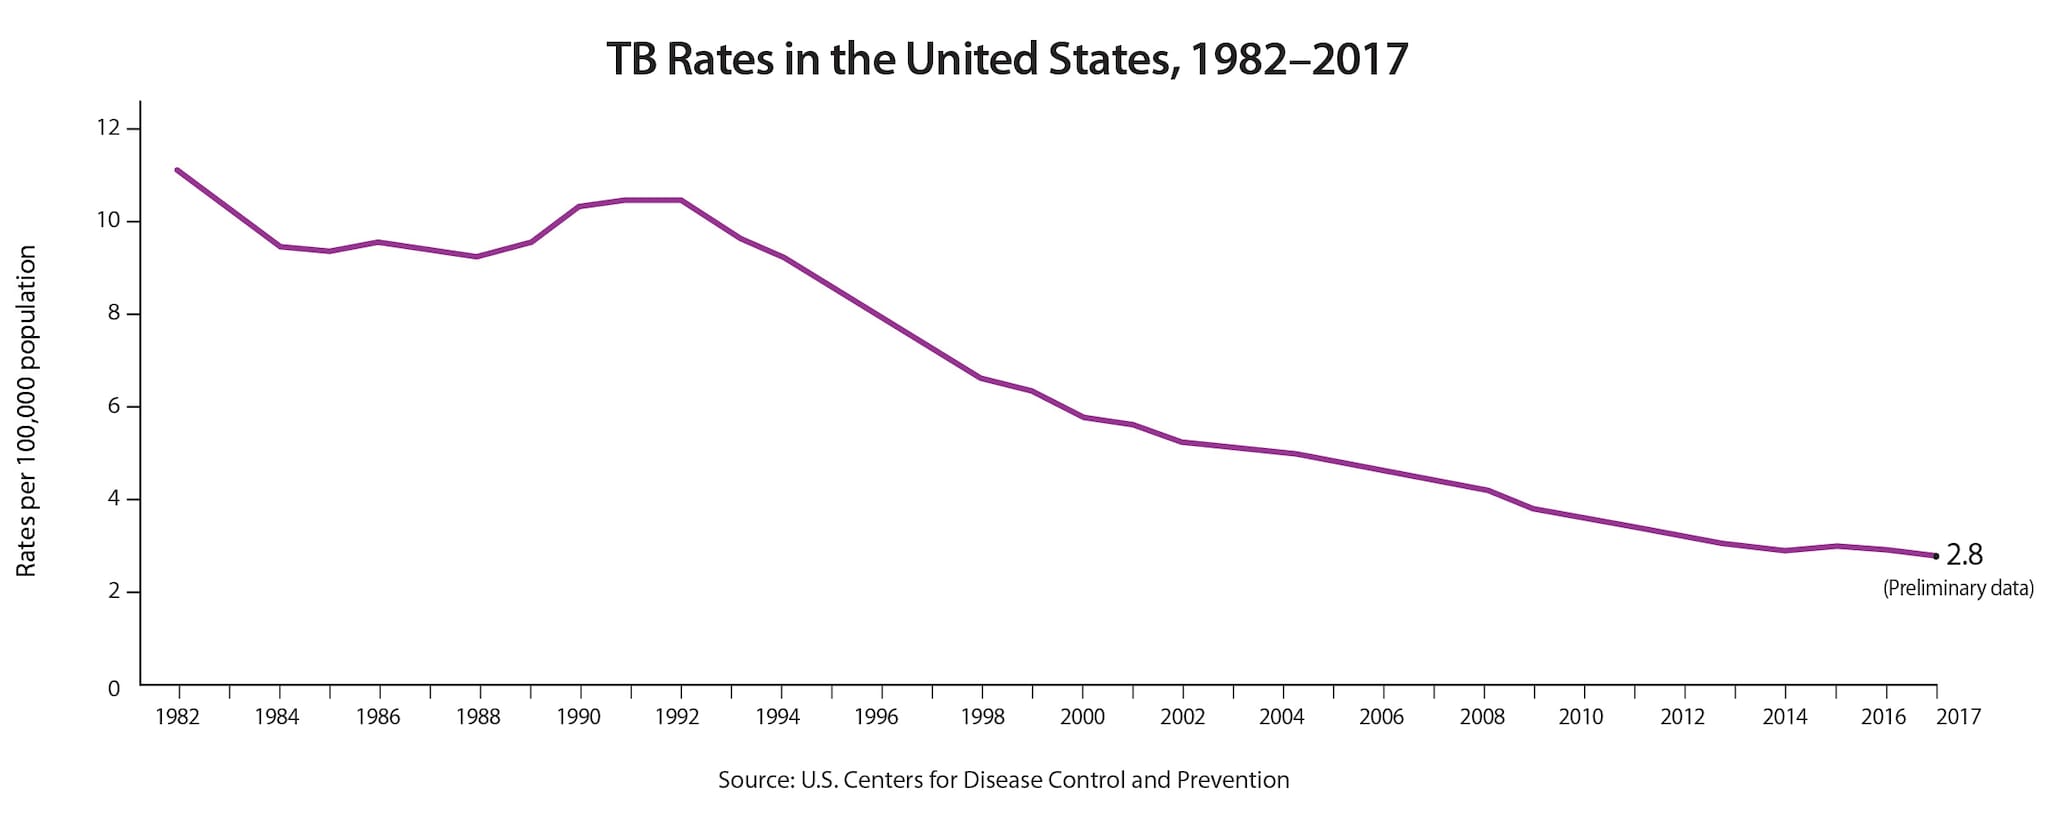
TB Rates in the United States, 1982-2017

This line graph shows the TB rates in the United States between 1982 and 2017. There was a resurgence of TB in the mid-1980s with several years of increasing case counts until its peak in 1992. In 1993, case counts began decreasing again. While overall rates have declined since the peak, the decline has slowed significantly from 2012-2017. This slow progress threatens the realization of TB elimination in this century.

View High Resolution Version
View Data Table

In 2017, preliminary data indicate a rate of 2.8 per 100,000 population. This is the lowest rate on record, representing a 2.5% decrease in from 2016 to 2017. However, the TB rate remains at levels 28 times higher than the TB elimination target rate.


Source link

Facebook
Twitter
LinkedIn
Pinterest